Hardware
Edge AI sensor
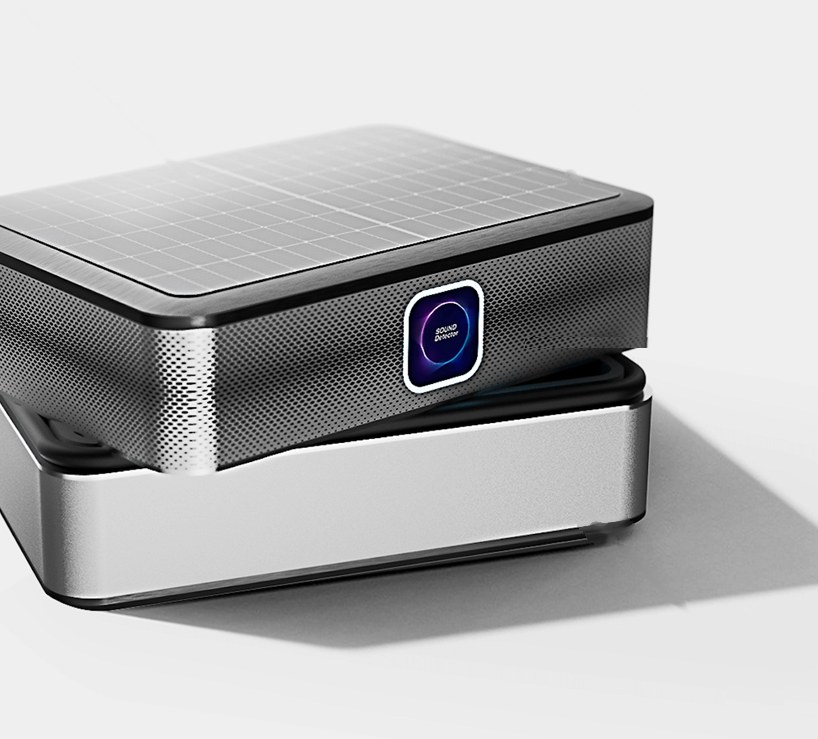
Analyzes sound where it is installed.
A small unit with a built-in solar panel that runs the AI on the device.
See the details →We design the sensor hardware, the microphone array, the on-device AI, and the data structure ourselves. We test in real installations, so performance holds up when conditions change.
Hardware, array design, on-device software, and the data record. Pick a part to read the details below.
Analyzes sound where it is installed.
A small unit with a built-in solar panel that runs the AI on the device.
See the details →Spacing set for each site.
Wide, narrow, or mixed spacing, chosen by the sounds you need to detect and where.
See the details →About 95% less data, by calculation.
Only the analysis results and the audio from each event leave the sensor.
See the details →Sound, place, and decision in one record.
Each event is stored with its surroundings and the reviewer's decision.
See the details →The sensor analyzes sound on the device, so it does not need to send every sound to a server. A solar panel is built into the unit, which reduces the power work needed at installation.
| Real-time detection | 24-hour monitoring in place of manual measurement |
|---|---|
| Location | Estimates where a sound came from and its direction |
| AI classification | Motorcycles, horns, construction, and equipment faults |
| Edge computing | AI runs on the device itself |
| Multimodal AI | Combines sound with video and other sensors |
| Big data | Analyzes stored records by area and hour |
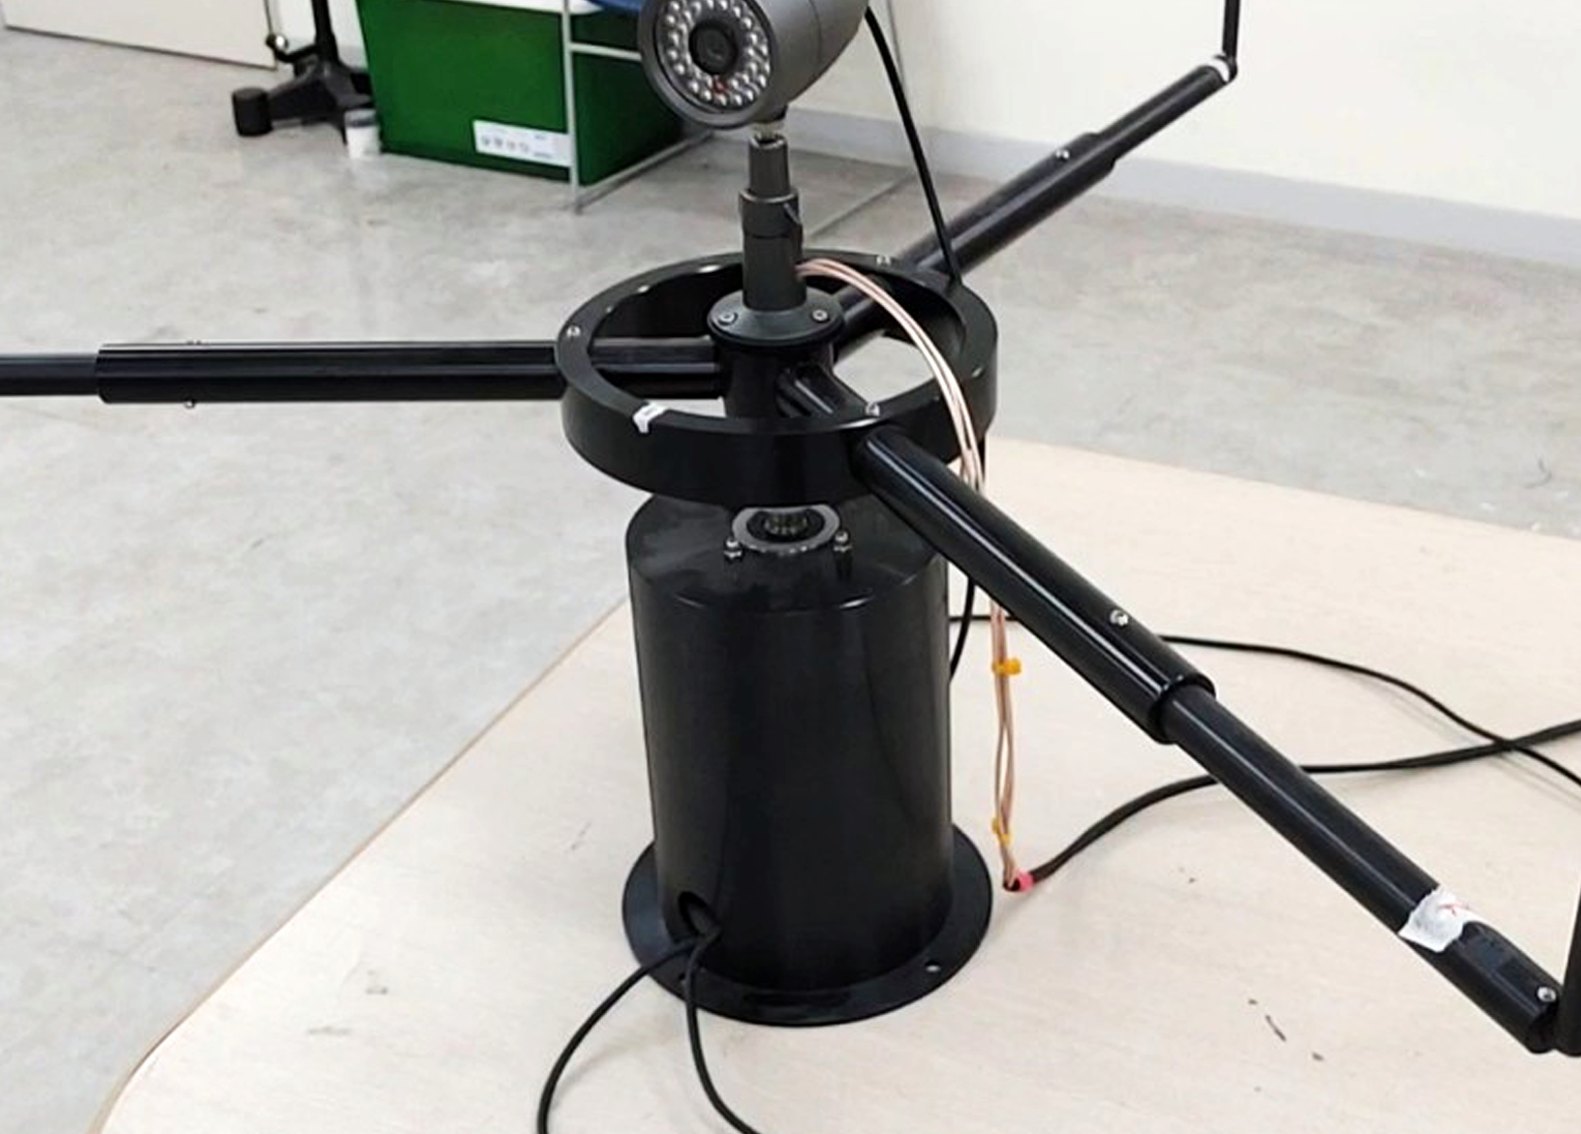
Spacing set for each site.
We do not use one array design everywhere. We choose the spacing and signal processing based on which sounds you need to detect, and where.
Better at judging the direction of distant and low sounds. Suits wide roads and open areas.
Picks up high-pitched and nearby sounds precisely. The smaller unit fits tight spots.
Combines wide and narrow spacing for sites where several kinds of sound occur together.
About 95% less data, by calculation.
Sending all data to a server makes transmission and storage costs keep growing. Our sensors analyze on site and send only the results and the raw audio from the moment of an event.
The figure is calculated from 16 kHz, 16-bit mono raw audio. It assumes only 5% of the raw audio is sent, along with the analysis results. This is not a measured saving. Actual communication costs depend on your plan and operating conditions.
Data one sensor sends per day
About 95% less
Calculated value, not a measured saving.
A decibel reading alone rarely explains why residents are upset. CUSMOS records where and when a sound happened and what was decided, so the next similar case has a precedent.
Sound type, level, location, and time
Nearby homes, schools, and roads
The reviewer's judgment and the follow-up action
Regional noise impact and whether a policy worked
Noise is the largest category of environmental complaints in Korea, at 46.5% in 2024. Yet 1,766 of the 1,828 sites in Korea's national noise network are still measured by hand.
| Item | Traditional fixed station | CUSMOS sensor |
|---|---|---|
| Cost | About KRW 10 million per automatic station (2022, Daejeon project) | Compact unit that mounts on existing CCTV and vehicle-detection poles |
| Coverage | One automatic station per 500 m radius | Placed wherever complaints happen, as many units as needed |
| Measurement | Mostly manual. 96.6% of the national network | Automatic, 24 hours a day, with no staff on site |
| What you learn | Sound level | Sound type, sound level, and location |
The figures in this section are from Korea: the national noise network count, the 2022 Daejeon project, and the 2024 complaint share.