
For cities
Smart city noise monitoring
Officials see where and when noise happens, block by block.
Sensors on existing poles log the type, level, location, and time of each noise event.
Learn more →
Siheung pilot: about 60% fewer complaints in the installed area.
New York City's 311 service has logged about 834 noise complaints a day since 2010 (Bello et al., 2019).
About60%
Fewer noise complaints
Siheung pilot, installed area, Dec 2025 to Jun 2026
95%+
Sound classification accuracy
Siheung pilot, 2025 company report
30%
Fewer monitoring blind spots
KEPCO Taean power plant PoC

Siheung City
Local government

Chuncheon City
Local government

Inje County
Local government
Korea Pan-Ministerial Integrated Healthcare Association
Association

Kwangwoon University
University

Woosuk University
University
Gangwon Defense Venture Center
Public institution
Each sensor analyzes sound on the device. Only the analysis results and the audio from each event are sent out.
Officials see where and when noise happens, block by block.
Sensors on existing poles log the type, level, location, and time of each noise event.
Learn more →
Spots incidents outside the camera's view.
Sensors find where an abnormal sound came from and turn the nearest CCTV toward it.
Learn more →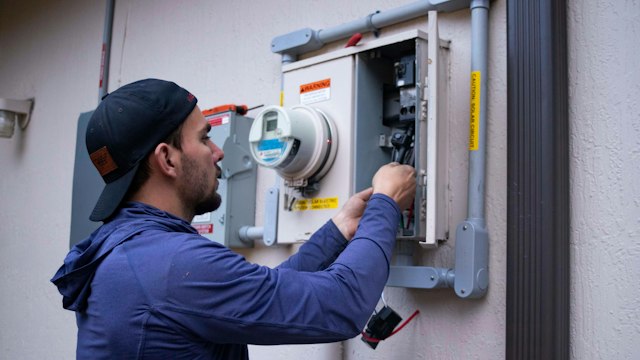
Inspectors can pinpoint a fault on screen.
Overlays the spots where ultrasound comes from on the live camera image.
Learn more →Alerts from the sensors appear on one control screen. Try the sample view below.
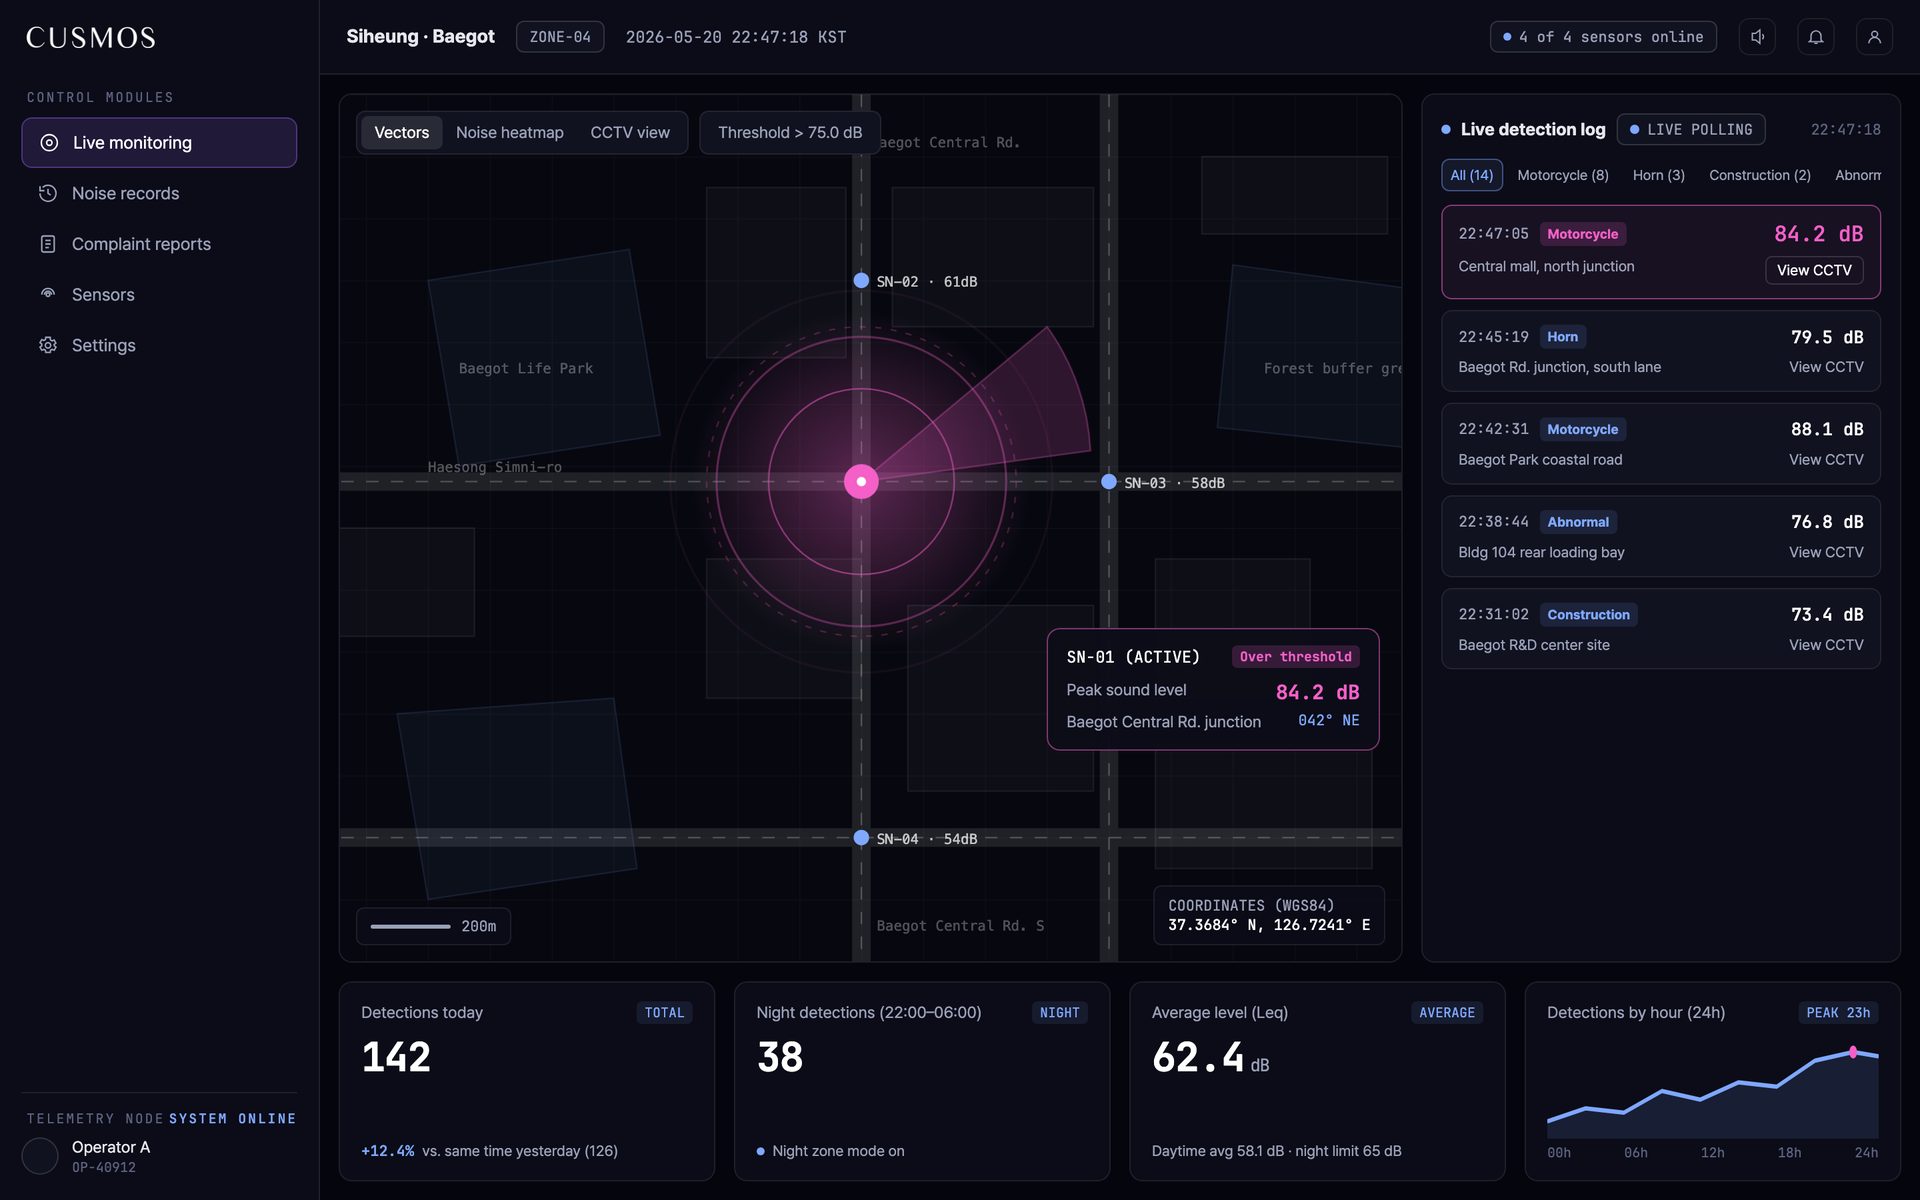
See where each sensor is and which way the latest sound came from. Switch to the noise heatmap or the CCTV view.
Each event lists its type, level, place, and time. Filter by type. The sample log also has a CCTV view button.
Detections today, night detections, and the average level, with an hourly chart.
The control screen above shows sample data.
About60%
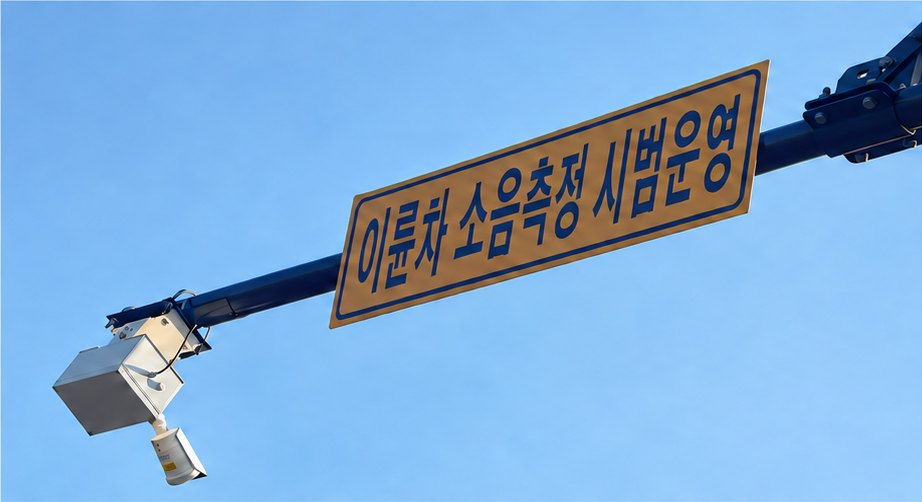
Motorcycle noise kept coming back on Baegot Haesong-simni-ro. Four sensors at four sites logged what caused each noise and when.
Installed area only, Dec 2025 to Jun 2026, guidance only, no enforcement.
Read the full case →